

Abstracts
Abstract
This practical report addresses a teaching activity that consists in students submitting small programming Challenges on a web platform as part of an Introduction to Programming course (CS1). An automatic correction system called CAFÉ assesses the Challenges and provides each student with immediate feedback and feedforward on both processes and products. This report focuses on the students’ acceptance of the tool by analysing promising results with respect to student participation, performance, and perception.
Keywords:
- CAFÉ,
- Programming Challenges,
- automatic feedback,
- automatic feedforward,
- acceptance,
- CS1
Résumé
Ce rapport porte sur une activité d’apprentissage qui consiste, pour les étudiants, à soumettre des Challenges de Programmation via un site Internet, dans le contexte d’un cours d’Introduction à la Programmation (CS1). Un système de correction automatique, appelé CAFÉ, évalue ces Challenges et transmet immédiatement à l’étudiant·e du feedback et du feedforward, autant à propos de sa performance que du processus qui y a mené. Ce rapport se concentre sur la réception, par les étudiant·e·s, de cet outil, en analysant des résultats prometteurs concernant la participation, la performance et la perception des étudiants.
Mots-clés :
- CAFÉ,
- Challenges de Programmation,
- feedback automatique,
- feedforward automatique,
- réception,
- CS1
Article body
Introduction
In Belgium, access to higher education is to a large extent non-selective. Thus, no Computer Science teacher can expect incoming students to have any particular background. Furthermore, many first-year students enter the program without really knowing the requirements for success in this curriculum in terms of knowledge acquisition, study methods, and time management. This leads to a 70% failure rate overall and a high drop-out rate throughout the year, and the Computer Science program is no exception, as is also attested elsewhere (Beaubouef and Mason, 2005; Watson & Li, 2014). This report shares our experience with the implementation of a Programming Challenges Activity (PCA) meant to help students adapt to the requirements of a first year introductory programming course (usually referred to as “CS1”) focused on the C programming language and basic algorithm design. As a semester-long learning activity, the PCA invites students to submit small pieces of code (called Challenges) on a web platform. Due to many constraints such as room availability, time, and limited human resources, using an automatic correction system seemed to be the obvious choice. The tool used, called CAFÉ – the French acronym for “Correction Automatique et Feedback pour les Étudiants” (Liénardy et al., 2020) – immediately corrects the programming Challenges and provides relevant feedback and feedforward (i.e., what should be done to improve a given submission). Several automated grading systems for programming exercises already exist, e.g., UNLOCK (Beaubouef et al., 2001), INGInious (Derval et al., 2015), Web-CAT (Edwards & Peres-Quinones, 2008), Kumar’s Problets (Kumar, 2013), Coderunner (Lobb & Harlow, 2016), CodingBat, and My Lab Programming, the online platform published by Pearson. Most of these tools perform test-based feedback: the student’s code is compiled (i.e., the process of translating the program, written in a high-level language understandable by humans, into lower level language understandable by the computer), corrected with unit testing, and then run accordingly to generate the feedback. In addition, UNLOCK addresses problem-solving skills in general (not just coding skills), while WebCAT enables students to write their own tests. Kumar’s Problets embed a feature allowing the code to be executed step by step. Singh et al. (2013) offer a more advanced feedback indicating the number of required changes along with suggestions for correcting the mistakes. CAFÉ differs from these other artifacts by also getting students to provide information about the reflection phase that preceded the code writing and by checking that the code matches this reflective step. This deliberate effort to embed a reflection phase makes CAFÉ compliant with “Graphical Loop Invariant Programming,” the programming methodology favoured in the course. The benefits of this methodology for students have been discussed in previous work (Liénardy et al., 2020). This paper reports on students’ exposure to the PCA and to the CAFÉ artifact supporting them. As an experience report, the investigation is guided by the question: “What are the effects of exposure to the PCA?”. These effects will be explored through three hypotheses:
-
Participation: all students seize the learning opportunity represented by the PCA;
-
Performance: participation in the PCA leads to learning gains in programming;
-
Perception: students report satisfaction regarding their experience with the PCA.
1. Method
1.1 Course and Participants
The CS1 course is held during the first semester of the academic year (i.e., mid-September to mid-December). The PCA complements the other teaching activities developed in our CS1 course: lectures on theory, practical sessions (exercises on paper), and laboratory sessions (exercises in front of a computer) (Liénardy et al., 2021). Table 1 presents statistics about the students who took the course during the 2018-2019 academic year. Our course was taken by 76 students; 84% of them were in their first year at the university; 8% were repeating the year; and 8% had transferred from another program. Overall, 61% of the students took the final exam, 21% showed up to sign the attendance sheet (without taking the exam), and 18% were absent. That year, the pass rate (in January, for the first exam session) was 24% counting all students and 39% counting only those who took the final exam. These figures are consistent with the success rate for first year university students in our country (Académie de recherche et d’enseignement supérieur, n.d.).
Table 1
Statistics about the students (N=76) who took our CS1 course in 2018-2019. The final exam pass rate is computed both for all the students and for the students who actually took the exam (excluding those who were absent and those who just showed up without taking the exam)

1.2 The Programming Challenge Activity
Practical Aspects
The PCA includes six small programming tasks (referred to as Challenges) spaced out over the semester. Each challenge must be completed within three days. On the first day (Wednesday, 4:00 p.m.), the students download instructions from the university’s eLearning platform. They tackle the programming task and submit their output to the CAFÉ correction program (Liénardy et al., 2020). The artifact corrects the students’ Challenges and, nearly instantaneously, quantifies their performance with a mark (from 0 to 20 points) that is explained in a message containing individual feedback (the result obtained by running their program, the expected result, and the locations of their mistakes) and feedforward (suggestions for improving their work). Based on this, the students can correct their mistakes and resubmit a new version of their code (twice at most). At the end of the Challenge (Friday, 6:00 p.m.), the latest submission determines the final mark. Each Challenge accounts for 2% of the final mark for the course.
The timeline for the PCA is provided in Figure 1. The first Challenge (called “Challenge 0” – not shown in Figure 1) helps students understand how CAFÉ works; it does not count toward the final mark. Challenges 1-5 are cumulative in terms of the course subjects covered (loops, plus Invariant, plus arrays, plus functions…). Challenges 2 to 4 build on each other to foster the internalization of the “Graphical Loop Invariant” programming methodology. The fifth Challenge is designed as an integrative task revolving around dynamic memory allocation and pointers.
Figure 1
Programming Challenge Activities timeline for the semester

The PCA also incorporates “Trump Cards,” which allow students to skip one of the Challenges. In effect, this Challenge will not count toward the student’s mark. Failure to submit an answer to a Challenge is equated with playing one’s single Trump Card.
Theoretical Background
Each individual Challenge and the progression from one to the next are moulded on “Assessment for Learning” (AfL) tenets in the field of higher education (Liénardy et al., 2021; Sambell et al., 2013): offering tasks of increasing difficulty, balancing summative and formative assessment, creating opportunities for practice and rehearsal” (Sambell et al., 2013) by allowing the students to submit up to three times and improve their output.
Following Karavirta et al.’s (2006) recommendation, CAFÉ limits the number of possible submissions to three in order to prevent “trial and error” strategies that would be contrary to the Graphic Loop Invariant approach that emphasizes reflection.
The feedback and feedforward produced by CAFÉ were carefully based on the literature promoting self-regulated learning. Among the established quality criteria for feedback (Keuning et al., 2019), CAFÉ instantiates the following procedural items: (i) individualized feedback (Brookhart, 2008), (ii) feedback focused on the task, not the learner (Narciss & Huth, 2004), and, (iii) feedback made directly available to the student to prevent them from becoming bogged down or frustrated (Knoblauch & Brannon, 1981). Contentwise, the feedback in CAFÉ can be informed by Keuning et al.’s threefold classification (2019): knowledge of mistakes (CAFÉ compiles and tests a student’s code, runs it, and warns the student if there are errors), knowledge about how to proceed (through feedforward, CAFÉ provides references to the theory course or hints about things that could improve the solution, as well as hints about improvements to the submitted Challenge), and knowledge of metacognition (CAFÉ checks that the student’s code aligns with the programming methodology introduced by our course).
Lastly, there are two pedagogical reasons for the “Trump Card” option: first, to relieve the instructors from dealing with the excuses of students who have not submitted their Challenge (Brauer, 2011), and second, to possibly increase the students’ perception of control – a factor in determining their motivation – (Viau, 2009) by allowing, on the learning path, a choice extending into the realm of self-regulated learning.
1.3 Data sources
1.3.1 Participation Data
The submission platform on which CAFÉ is run allows us to gather various data: submission time, number of submissions, and the student’s mark given by CAFÉ. The various submission times for a particular Challenge and a particular student can be used to determine the amount of time between two submissions.
1.3.2 Performance Data
In our CS1 course, each student is evaluated in two ways: continuous assessment and periodic assessment. Continuous assessment refers to the PCA (the subject of this report) and five multiple choice tests (MCQs) assessing the understanding and knowledge of theoretical concepts and C programming language specificities. Periodic assessment refers to two exams: a mid-term exam in late October or early November, and the final exam in January. MCQs and the PCA each account for 10% of the final grade, while the mid-term and final exams account for 15% and 65%, respectively. As this report is focused on the PCA, we limit the performance analysis to the grades automatically computed by CAFÉ after each submission during all the PCA.
1.3.3 Perception Data
A survey was sent to students after the final exam and about 22 of them responded, i.e., half of the students who took the final exam (see Table 1). The survey was anonymous so that the students could express themselves freely.
2. Results
The results are presented according to the 3P framework (Verpoorten et al. 2017) which recommends consistent analysis of any pedagogical innovation by gathering and meshing three types of data that reflect aspects of the students’ learning experience:
-
Participation: all students seize the learning opportunity represented by the PCA
-
Performance: participation in the PCA leads to learning gains in programming
-
Perception: students report satisfaction regarding their experience with the PCA
2.1 Participation: all students seize the learning opportunity represented by the PCA
2.1.1 Taking Challenges and Using Trump Cards
Figure 2 shows the students’ participation in the PCA over the semester. Participation decreased during the semester in absolute numbers from 86% to 29% (see blue in Figure 2). Logically, we can see a parallel rise in absences from 16% to 55% (see black in Figure 2). As far as the “Trump Cards” are concerned, they were played quite evenly among the Challenges at around 17% (see red in Figure 2), except for Challenge 3, which shows a peak of 27%. Overall, 7% of the students did all of the Challenges. The downtrend in participation did not affect triple submissions, which stood at 50% of participants for each Challenge (see dark blue in Figure 2).
Figure 2
Distribution of students’ participation in the PCA over the semester. “Trump Card” refers to students not submitting for the first time and “Absence” to students not submitting for at least the second time (or, in the case of Challenge 0, for the first time, since the Trump Card was not available for that Challenge)

2.1.2 Submission time
Time of submission during the Challenge
Each Challenge begins on a Wednesday at 4:00 p.m. and ends on Friday at 6:00 p.m. Figure 3 shows that Friday is the preferred day for the first submission for the graded Challenges 2, 4, and 5 (60% of submissions). Thursday is the second most popular day for the first submission. For nearly all of the Challenges, fewer than 20% of the students made their first submission on Wednesday.
Figure 4 deepens this analysis by using a heat map graph to provide an overview of the hourly distribution of submissions. On Wednesday, the first submissions occur mainly before 9:00 p.m. Thursdays show more night work, especially for Challenges 1 to 3. Fridays show a large number of last-minute first submissions. In this vein, Challenge 5 is an extreme example, as nearly all of the submissions may be classified into two categories: early on Wednesday and at the last minute on Friday. Finally, there are also some students who submit on Thursday and Friday mornings, when other lectures are scheduled.
Figure 3
Distribution of submissions per day for each PCA

Figure 4
First submission time heat map. The color represents the percentage of submissions (N = 76, the total number of students). Red indicates more submissions; blue indicates fewer

Time between submissions
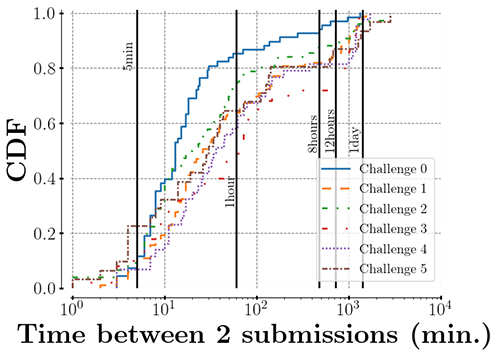
One of the main features of CAFÉ is that it provides the students with feedback and feedforward. To take advantage of this information, students should spend some time between submissions. Figure 5 provides a degree of insight into the time intervals between consecutive submissions for all Challenges. All of the curves follow the same profile, except for Challenge 0. During Challenge 0, nearly 40% of the students resubmitted within 10 minutes and almost 90% of them resubmitted within 1 hour. For the other Challenges, 10% of the students resubmitted within 5 minutes. As well, about 50% of them waited between 10 minutes and 1 hour before resubmitting. The plateau between 3 hours and 12 hours indicates that very few students wait that length of time before submitting again. Finally, between 15% and 20% of the students waited more than 12 hours. As far as Challenge 5 is concerned, there is a peak at the beginning of the curve: more than 20% of the students resubmitted within 5 minutes.
Figure 5
Time between submissions for a PCA. This figure plots an empirical cumulative distribution function of the time difference in minutes between consecutive submissions. Note that a logarithmic scale is used for the x-axis: time intervals (5 min, 1 h, 8 h, 12 h, and 1 day) are represented by black vertical bars to make the figure easier to read
2.2 Performance: participation in the PCA leads to learning gains in programming
2.2.1 Inter-Challenge Scores
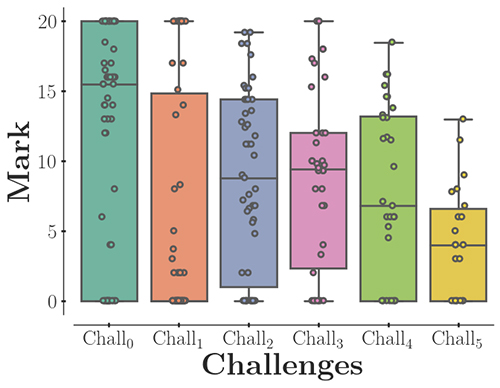
Figure 6 shows a box plot of the students’ marks obtained for their first submission in each Challenge. Considering the four quartiles of the mark distribution, the box plots reveal that first-submission results tend to decrease as the semester goes along.
Figure 6
Box plot of the students’ results for their first submission for each Challenge. Each dot represents a result. The boxes and whiskers represent the four quartiles
2.2.2 Intra-Challenge Scores
Since CAFÉ allows students to resubmit enhanced solutions to a Challenge, it is worth making sure that multiple submissions do indeed enable students to improve their results. Table 2 shows that, except for Challenge 5, the majority of the students who submitted twice ended up with higher marks (See the “+” line). The same observation can be made for students who submitted three times. For Challenges 0 to 5, the total percentages of students who submitted three times and improved their grades were 79%, 50%, 82%, 58%, 82%, and 73%, respectively. Reduced grades (lines “= –” + “– =” + “– –”) were uncommon and mainly involved 10% of the students dealing with Challenge 3.
Table 2
Improvement between submissions for each Challenge. The table is divided into two parts. The top part relates to students who submitted just twice for a particular Challenge. The three lines labeled “+”, “–” and “=” show the percentage of students’ results that were higher, lower, and did not change, respectively, from one submission to the next. The bottom part shows the results for students who submitted three times. There are more lines, since each additional submission may result in a higher or lower mark or no change. For example, for each Challenge, the line labeled “+ +” indicates the proportion of students who submitted three times and whose marks were higher after both additional attempts; the line “= –” shows the percentage of students whose second try (first resubmission) made no change in their marks and who then scored lower on their last try; and so on for the other lines

2.3 Perception: Students Report Satisfaction Regarding their Experience with the PCA
The survey received 22 responses from students who took part in the Challenges.
2.3.1 Overall Benefits of the PCA
Respondents claim to benefit from the PCA, since 86% agree with the statement “Submitting 5 Challenges consisting of writing code to solve a problem was a good way to make me work regularly” (see Figure 7, Q1). Most respondents also agreed with the statement “Submitting 5 Challenges consisting of writing code to solve a problem made me feel confident about my programming skills” (see Figure 7, Q2).
Figure 7
Students’ survey responses (N = 22). Q1 is “Submitting five Challenges consisting of writing code to solve a problem was a good way to make me work regularly” and Q2 is “Submitting five Challenges consisting of writing code to solve a problem made me feel confident about my programming skills.” Both of them use a Likert scale

When asked whether the feedback prompted them to resubmit, the response was positive: 82% (18/22) of the students stated this for three Challenges or more (see Figure 8, 1st line). Responses to other questions bolster this positive impression. When asked if the feedback and feedforward helped them to better understand the course content, 59% of the respondents reported that this was the case for three Challenges or more (see Figure 8, 2nd line). When asked if the feedback made them realize that they had a learning gap, 46% of the respondents answered that this was so for three Challenges or more (see Figure 8, 3rd line). One question gives insight into how the students used the feedback/feedforward between consecutive submissions. In fact, 59% of the respondents (13/22) reread the theory course for three Challenges or more (Fig 8, 4th line), 9% of them (2/22) retried some additional exercises for three Challenges or more (Fig 8, 5th line), 27% of them (6/22) looked for information on the course website for three Challenges or more (Fig 8, 6th line) and 18% of them (4/22) asked the teaching team questions during three Challenges or more (Fig 8, 7th line).
Figure 8
Students’ survey responses (N = 22). The first three lines correspond to information the students received through feedback from CAFÉ; the last four lines correspond to the students’ reported reactions prompted by feedback

2.3.2 Reasons for Playing the Trump Card
The students were asked why they played their Trump Card when they did. As shown in Table 3, 23% (5/22) of the respondents never played their Trump Card. A deeper analysis of the students who never played their Trump Card reveals that all of them responded to the survey. The most common reason to play one’s Trump Card (8/22, 36%) was an organizational problem (e.g., lack of time to complete the Challenge) and was quite well distributed throughout the semester (the Trump Cards played by the respondents that gave this reason are spread over all of the PCAs – see Table 3). The second most common reason was always mentioned in relation to Challenge 5: 27% of the students (6/22) were afraid that they would lower their grade if they took the Challenge or were already satisfied with their grade. They adopted a strategy that gave more weight to the score already “earned” than to the experience they could gain by completing Challenge 5. Apart from these main reasons, one student mentioned the difficulty of Challenge 4 and two of the respondents confessed to some “laziness.”
Table 3
Reasons given in response to the question: “Why did you play your Trump Card when you did?” (N = 22)

3. Discussion
3.1 Participation: All Students Seize the Learning Opportunity Represented by the PCA
3.1.1 Taking Challenges and Using Trump Cards
For all of the Challenges, a majority of participants actually took advantage of resubmitting to improve their performance (see Figure 2). This is exactly what the PCA was designed for, in line with the creation of “opportunities for practice and rehearsal” espoused by the AfL (Sambell et al., 2013). Similarly, participants took the opportunity to play their Trump Card regularly throughout the semester. In this respect, two very different behaviours could be distinguished: some students used it as it was intended and others simply dropped the course, in which case their first absence was labeled as a Trump Card. These latter students did not participate in subsequent Challenges. The number of drop-outs increased regularly over the semester. A steep increase can be seen for Challenge 3, which came right after the mid-term exam (see Figure 1). This suggests that the mid-term exam results made some students decide to drop the course (and perhaps change their program)[3]. By the end of the semester, more than 40% of the students seem to have dropped the course. This is confirmed by the final exam participation rate (61%; see Table 1).
3.1.2 Submission Time
The Results section presents data regarding the submission times during the course of a Challenge and the time between consecutive submissions. The following discusses the PCA parameters related to this data, i.e., the length of the Challenge and the number of submissions allowed.
Time of submission during the Challenge
Currently, each Challenge takes place over three days: from Wednesday at 4:00 p.m. to Friday at 6 p.m. At first glance this may seem short, but the problems to be solved are not that difficult. In fact, designing a Challenge consists in finding a good balance: the problem should be difficult enough to challenge the students without overwhelming them with work. An increase in length could be considered, but Challenges could not last for more than one week; otherwise, they might interfere with the students’ workload for their other first year courses. It is also worth noting that each Challenge is aligned with other teaching activities in our CS1 course (theory lectures, practical sessions, MCQs) that all address the same topic. To a certain extent, and following Nicol’s second principle of good assessment and feedback practice consisting in encouraging students to spend “‘time and effort’ on challenging learning tasks” on a regular basis (Nicol, 2009, p. 32), the Challenge’s rhythm helps to pace the students’ study and work. Keeping this in mind, if a Challenge lasted much longer, there would be a risk of some students being left behind through procrastination and putting off the moment they decide to focus on a Challenge. In addition, one could think about just adding the weekend to the Challenge (i.e., from Wednesday, 4:00 p.m. to Sunday, 6:00 p.m.), but the various data discussed in this paper show that this would not be effective. Indeed, we have shown that a majority of students are more likely to make their first submission on Friday (currently the last day of the Challenge) than on any other day. (It is worth noting that the lectures are held on Wednesdays. If the students are tired, this could explain why they do not begin to submit on that day.) If the Challenge included the weekend, we could assume that a certain number of first submissions would be delayed until the Saturday or even Sunday. While an automatic correction system could clearly handle such a schedule, the teaching team would not be available in case of problems (e.g., technical issues with the submission platform). Finally, the students’ quality of life would be affected if they chose poorly and put off doing their work until the Sunday. Taking all this into consideration, extending the length of the Challenges does not seem advisable.
Time between submissions
The number of available submissions was meant to be a scarce resource so that students would think twice before submitting and take time to reflect on the feedback and feedforward they received. Currently, we allow up to three submissions per Challenge, following the recommendations of Karavirta et al. (2006), who clustered several behaviors in a group of students using an automatic assessment tool with an unlimited number of submissions. Among these, they identified those they call “the iterators” who submit a high number of times without necessarily getting good grades, which indicates that they are not working effectively. Karavirta et al. thus recommend limiting the number of resubmissions to “guide [them] in their learning process.” We could increase the number of resubmissions to 4 or even 5. However, increasing the number of submissions too much would decrease the risk per submission. That would allow students to perform a kind of “test-driven development” (i.e., submitting quickly while the tests generate errors), which is contrary to the programming methodology taught in the course. This behavior can, in fact, be observed in Challenge 5 (see Figure 5): more than 20% of students resubmitted within 5 minutes, even if, at first glance, this is not the best way to benefit from the feedback and feedforward provided. Moreover, the CAFÉ system was not designed to be used like this, since it also emphasizes the programming methodology being learned by the students. On the other hand, if the number of submissions is increased and the students do take time and make use of the opportunity to close the gap between their last submission and a better outcome, thus completing the feedback loop (Sadler, 1989), it means that more time should be given for the Challenges. The previous section explains why this is not desirable. In effect, if the students still need more time and more feedback for a particular Challenge, it would indicate that the Challenge was too difficult and should be redesigned.
3.2 Performance: Participation in the PCA Leads to Learning Gains in Programming
3.2.1 Inter-Challenge Score
The decreases observed throughout the semester (see Figure 6) could be explained by the increase in the tasks covered by the Challenges, which are cumulative: students might experience a snowball effect if they progressively accumulated learning gaps. But it should be kept in mind that Figure 6 shows students’ marks for the first submission, and CAFÉ allows several submissions. For Challenges 0 and 1, nearly 20% of students made a single submission: students getting a good grade on the first attempt do not need to resubmit. For Challenges 2 to 5, the lower results make resubmission essential in order to make progress and accumulate knowledge. This is not surprising. In fact, it is exactly why multiple submissions were allowed in the first place, followed by feedback that the students could use to progressively improve their performance.
3.2.2 Intra-Challenge Score
Students who only submit twice may be satisfied with their score, which is evidenced by the high number of increases. On the other hand, students who were not satisfied could submit again, since CAFÉ allows this, establishing itself as a tool likely to have a positive impact on the goals students set for themselves and their ability to feel highly committed, a condition notably required by Tinto (1999).
3.3 Perception: Students Report Satisfaction Regarding their Experience with the PCA
3.3.1 Overall Benefit of the PCA
The students’ perceptions tend to confirm that CAFÉ achieved one of its primary goals, i.e., to make them work on a regular basis. Students also state that they gained confidence in their programming skills (see Figure 7). This result is consistent with the purpose of “creating opportunities for practice and rehearsal” from the AfL (Sambell et al., 2013). Moreover, they acknowledged that the feedback itself encouraged them to take advantage of an additional submission (see Figure 8, first line).
As for the students’ reactions to the feedback and feedforward (see Figure 8, lines 4 to 7), it is not surprising that a majority of the respondents reread the theory course for more than three Challenges because CAFÉ directs them specifically to the course (e.g., gives the exact location of the relevant subsection). The other actions are less often explicitly suggested. Contact with the teaching team is the last resort if the student has a question about the feedback or a problem with the CAFÉ system itself. However, CAFÉ has been designed to limit that kind of interaction.
With regard to the feedback portion of the information transmitted by CAFÉ about the students’ performance (see Figure 8, lines 2 and 3), the data tends to show that it is useful for the students to know where they went wrong, if we follow the classification by Keuning et al. (Keuning et al., 2019). This result is also aligned with the AfL principle of providing students with “formal feedback to improve learning” (Sambell et al., 2013).
3.3.2 Reasons for Playing the Trump Card
Introducing the Trump Card mechanism is a double-edged sword. On one hand, it was thought that the Trump Card would make students take responsibility for their learning, avoid making excuses for not submitting, and increase their perception of control over the course (and thus their engagement and motivation). Data shows that some students indeed used their Trump Card to cope with organizational issues (see Table 3). On the other hand, it allows students to develop short-term strategies to maximise their PCA grade (e.g., by avoiding a bad mark on a Challenge perceived as too difficult, see Table 3) that can lead them to avoid practising the task featured in the Challenge that they discarded using the Trump Card. This is illustrated by Challenge 5. According to the survey, at the open question “The Challenge 5 submission rate was low this year. However, it had been announced that one or more questions in the final exam would focus on the subject tackled by this Challenge. In your opinion, what is the cause of this?”, some students (4/22) “regretted using [their] Trump Card” and recognized that “taking the Challenge would have helped them for the final exam”. If we deepen this analysis by looking at the final exam results for the questions addressing the same subject as Challenge 5 (pointers and dynamic memory allocation), we observe that every student who succeeded in Challenge 5 also got these questions right. It should be noted that they first improved their score in Challenge 5 through multiple submissions. However, those who did not submit code for Challenge 5 failed at the same kind of questions on the final exam.
We still believe that the Trump Card system must be maintained. However, this means, first, that the students must be made more aware of the potential consequences of their choices (i.e., applying a poor/short-term strategy) and, second, that there must be debunking of any rumors about the difficulty of a given Challenge that would discourage students from even trying it.
Conclusion and Future Work
This report discussed students’ acceptance of computer Programming Challenge Activities (PCA) in a CS1 Course and presented data about the students’ participation, performance, and perception. The PCA enables the students to work on a regular basis. Five times during the semester, they submit programming exercises (called Challenges) on a web platform and automatically get feedback and feedforward, which they can take into account to improve their solution. They say that doing this gives them more confidence in their programming skills. These promising results encourage the continued use of the PCA in the future. Also, providing every student with individual feedback up to three times for each Challenge would not be feasible without an automatic system like CAFÉ. Although it is not self-sufficient, the system is a good complement to the other teaching activities such as the theory course, exercises, and lab sessions. Furthermore, the data allows us to validate the PCA parameters, such as the schedule, number of submissions, Trump Card, etc. For instance, the Trump Card system can be maintained if the students are made more aware of the consequences of using it; the length of the Challenge (three days) can be retained since a majority of students start to work on the last day of a Challenge. The analysis of participation data revealed a trend in dropping the course, with a peak just after the mid-term exam. A deeper focus on this phenomenon should make it possible to understand and, ultimately, try to mitigate it.
Limitations
While the survey link was sent to all enrolled students, we had no means of collecting opinions from those who chose not to respond (whether they left the program or not). These opinions would have been valuable in our analysis.
Appendices
Notes
References
- Académie de recherche et d’enseignement supérieur. (n.d.). Statistiques / Indicateurs de l’enseignement supérieur. http://ares-ac.be/...
- Beaubouef, T., Lucas, R., & Howatt, J. (2001). The UNLOCK system: Enhancing problem solving skills in CS-1 students. ACM SIGCSE Bulletin, 33(2), 43–46. https://doi.org/10.1145/571922.571953
- Beaubouef, T., & Mason, J. (2005). Why the high attrition rate for computer science students: Some thoughts and observations. ACM SIGCSE Bulletin, 37(2), 103–106. https://doi.org/10.1145/1083431.1083474
- Boud, D. (2000). Sustainable assessment: Rethinking assessment for the learning society. Studies in Continuing Education, 22(2), 151–167. https://doi.org/10.1080/713695728
- Brauer, M. (2011). Enseigner à l’université: conseils pratiques, astuces, méthodes pédagogiques. Armand Colin.
- Brookhart, S. M. (2008). How to give effective feedback to your students. Association for Supervision & Curriculum Development (ASCD).
- Derval, G., Gego, A., Reinbold, P., Frantzen, B., & Van Roy, P. (2015). Automatic grading of programming exercises in a MOOC using the INGInious platform. In M. Lebrun, M. Ebner, I. de Waard, & M. Gaebel (Eds.), Proceedings papers of the European Stakeholder Summit on Experiences and Best Practices in and Around MOOCs (EMOOCS’15) (pp. 86–91). Université catholique de Louvain. http://hdl.handle.net/2078.1/182120
- Edwards, S. H., & Perez-Quinones, M. A. (2008). Web-CAT: Automatically grading programming assignments. ACM SIGCSE Bulletin, 40(3), 328. https://doi.org/10.1145/1384271.1384371
- Karavirta, V., Korhonen, A., & Malmi, L. (2006). On the use of resubmissions in automatic assessment systems. Computer Science Education, 16(3), 229–240. https://doi.org/10.1080/08993400600912426
- Keuning, H., Jeuring, J., & Heeren, B. (2019). A systematic literature review of automated feedback generation for programming. ACM Transactions on Computing Education (TOCE), 19(1), 1–43. https://doi.org/10.1145/3231711
- Knoblauch, C. H., & Brannon, L. (1981). Teacher commentary on student writing: The state of the art. Freshman English News, 10(2), 1–4. http://jstor.org/...
- Kumar, A. N. (2013). Using problets for problem-solving exercises in introductory C++/Java/C# courses. In Proceedings of 2013 IEEE Frontiers in Education Conference (pp. 9–10). https://doi.org/10.1109/FIE.2013.6684774
- Liénardy, S., Donnet, B., & Leduc, L. (2021). Promoting engagement in a CS1 course with assessment for learning. A practice report. Student Success, 12(1), 102–111. https://doi.org/10.5204/ssj.1668
- Liénardy, S., Leduc, L., Verpoorten, D., & Donnet, B. (2020). CAFE: Automatic correction and feedback of programming challenges for a CS1 course. In A. Luxton-Reilly & C. Szabo (Chairs), Proceedings of the Twenty-Second Australasian Computing Education Conference (ACE’20) (pp. 95–104). https://doi.org/10.1145/3373165.3373176
- Lobb, R., & Harlow, J. (2016). Coderunner: A tool for assessing computer programming skills. ACM Inroads, 7(1), 47–51. https://doi.org/10.1145/2810041
- Narciss, S., & Huth, K. (2004). How to design informative tutoring feedback for multi-media learning. In H. M. Niegemann, D. Leutner, & R. Brünken (Eds.), Instructional design for multimedia learning (pp. 181–195). Waxmann.
- Nicol, D. (2009). Quality enhancement themes: The first year experience. Transforming assessment and feedback: Enhancing integration and empowerment in the first year. Quality Assurance Agency for Higher Education. http://dera.ioe.ac.uk/11605
- Sadler, D. R. (1989). Formative assessment and the design of instructional systems. Instructional Science, 18(2), 119–144. https://doi.org/10.1007/BF00117714
- Sambell, K., McDowell, L., & Montgomery, C. (2013). Assessment for learning in higher education. Routledge. https://doi.org/10.4324/9780203818268
- Singh, R., Gulwani, S., & Solar-Lezama, A. (2013). Automated feedback generation for introductory programming assignments. In H.-J. Boehm et C. Flanagan (Chairs), PLDI’13 : Proceedings of the 34th ACM SIGPLAN Conference on Programming Language Design and Implementation (pp. 15‑26). https://doi.org/10.1145/2491956.2462195
- Tinto, V. (1999). Taking retention seriously: Rethinking the first year of college. NACADA Journal, 19(2), 5–9. https://doi.org/10.12930/0271-9517-19.2.5
- Verpoorten, D., Parlascino, E., André, M., Schillings, P., Devyver, J., Borsu, O., Van de Poël, J. F., & Jérôme, F. (2017). Blended learning. Pedagogical success factors and development methodology. Université de Liège, IFRES. http://hdl.handle.net/2268/209645
- Viau, R. (2009). La motivation en contexte scolaire (2nd ed.). De Boeck.
- Watson, C., & Li, F. W. B. (2014). Failure rates in introductory programming revisited. In A. Cajander, M. Daniels, T. Clear, & A. Pears (Chairs), Proceedings of the 2014 Conference on Innovation & Technology in Computer Science Education (ITiCSE’14) (pp. 39–44). https://doi.org/10.1145/2591708.2591749
List of figures
Figure 1
Programming Challenge Activities timeline for the semester
Figure 2
Distribution of students’ participation in the PCA over the semester. “Trump Card” refers to students not submitting for the first time and “Absence” to students not submitting for at least the second time (or, in the case of Challenge 0, for the first time, since the Trump Card was not available for that Challenge)
Figure 3
Distribution of submissions per day for each PCA
Figure 4
First submission time heat map. The color represents the percentage of submissions (N = 76, the total number of students). Red indicates more submissions; blue indicates fewer
Figure 5
Time between submissions for a PCA. This figure plots an empirical cumulative distribution function of the time difference in minutes between consecutive submissions. Note that a logarithmic scale is used for the x-axis: time intervals (5 min, 1 h, 8 h, 12 h, and 1 day) are represented by black vertical bars to make the figure easier to read
Figure 6
Box plot of the students’ results for their first submission for each Challenge. Each dot represents a result. The boxes and whiskers represent the four quartiles
Figure 7
Students’ survey responses (N = 22). Q1 is “Submitting five Challenges consisting of writing code to solve a problem was a good way to make me work regularly” and Q2 is “Submitting five Challenges consisting of writing code to solve a problem made me feel confident about my programming skills.” Both of them use a Likert scale
Figure 8
Students’ survey responses (N = 22). The first three lines correspond to information the students received through feedback from CAFÉ; the last four lines correspond to the students’ reported reactions prompted by feedback
List of tables
Table 1
Statistics about the students (N=76) who took our CS1 course in 2018-2019. The final exam pass rate is computed both for all the students and for the students who actually took the exam (excluding those who were absent and those who just showed up without taking the exam)
Table 2
Improvement between submissions for each Challenge. The table is divided into two parts. The top part relates to students who submitted just twice for a particular Challenge. The three lines labeled “+”, “–” and “=” show the percentage of students’ results that were higher, lower, and did not change, respectively, from one submission to the next. The bottom part shows the results for students who submitted three times. There are more lines, since each additional submission may result in a higher or lower mark or no change. For example, for each Challenge, the line labeled “+ +” indicates the proportion of students who submitted three times and whose marks were higher after both additional attempts; the line “= –” shows the percentage of students whose second try (first resubmission) made no change in their marks and who then scored lower on their last try; and so on for the other lines
Table 3
Reasons given in response to the question: “Why did you play your Trump Card when you did?” (N = 22)